

In October, a Sunday Sundries post showed the most-to-least frequent birth dates in Canada from 1995 to 2025. September was the most frequent, December the least. I wondered about the situation in the UK over a longer period. Enter FreeBMD.
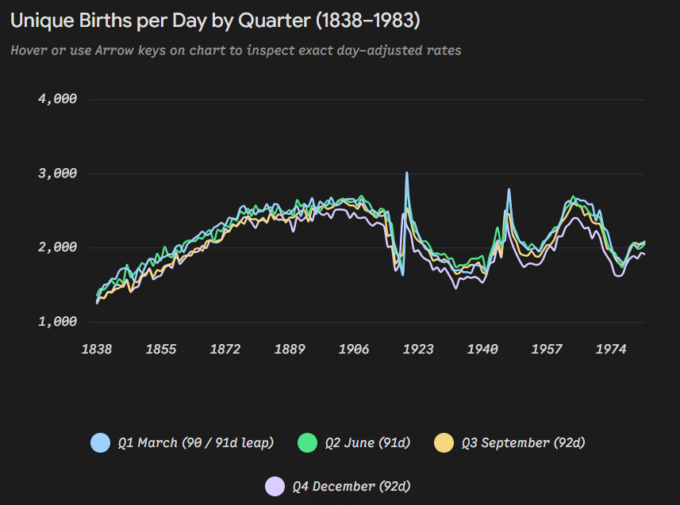
From July 1837 to December 1983, FreeBMD has quarterly statistics.
Early Period: Civil registration began in July 1837 with just 76,120 unique births in the September quarter (Q3) due to initial under-registration. Over the next four decades, improved compliance and rapid population growth pushed quarterly unique births past the 200,000 threshold for the first time in March (Q1) 1866.
Four-Stage Migration of the Peak Season: The dominant daily birth peak migrates across four distinct eras, shifting from March (Q1) dominance in the Victorian era (1838–1890) to June (Q2) dominance across the Edwardian and interwar periods (1891–1955), returning to March during the 1960s baby boom (1956–1977), and moving to September (Q3) in the final years (1978–1983).
The Deepened December Trough: The 92-day December quarter records the lowest daily birth rate in 136 out of 146 full years (93% of the series).
Steady Ascent of the September Quarter: The September quarter climbs progressively across every historical era, rising from a deep mid-Victorian secondary trough (96.2% of the annual daily mean in 1840–1869) to overtake March in the 1930s and ultimately become the #1 daily birth quarter (102.1% of the annual mean) by 1978–1983.
Modern Compression of Seasonal Spread: Outside of massive post-war demobilization swings—such as March 1920’s all-time record of 3,016 unique births per day—the intra-year daily spread between the peak quarter and the December trough compressed by roughly a third, narrowing from 11%–16% in Victorian and interwar decades to an average of 7.8% by 1978–1983.